Empowering consumers as drivers of sustainability in Asia's financial sector
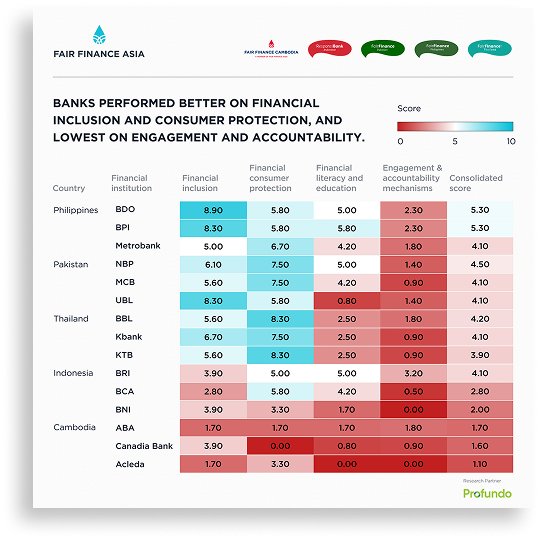
A set of data visualisations and a key infographic that translate Fair Finance Asia's banking scorecard into shareable, accessible content.
Fair Finance Asia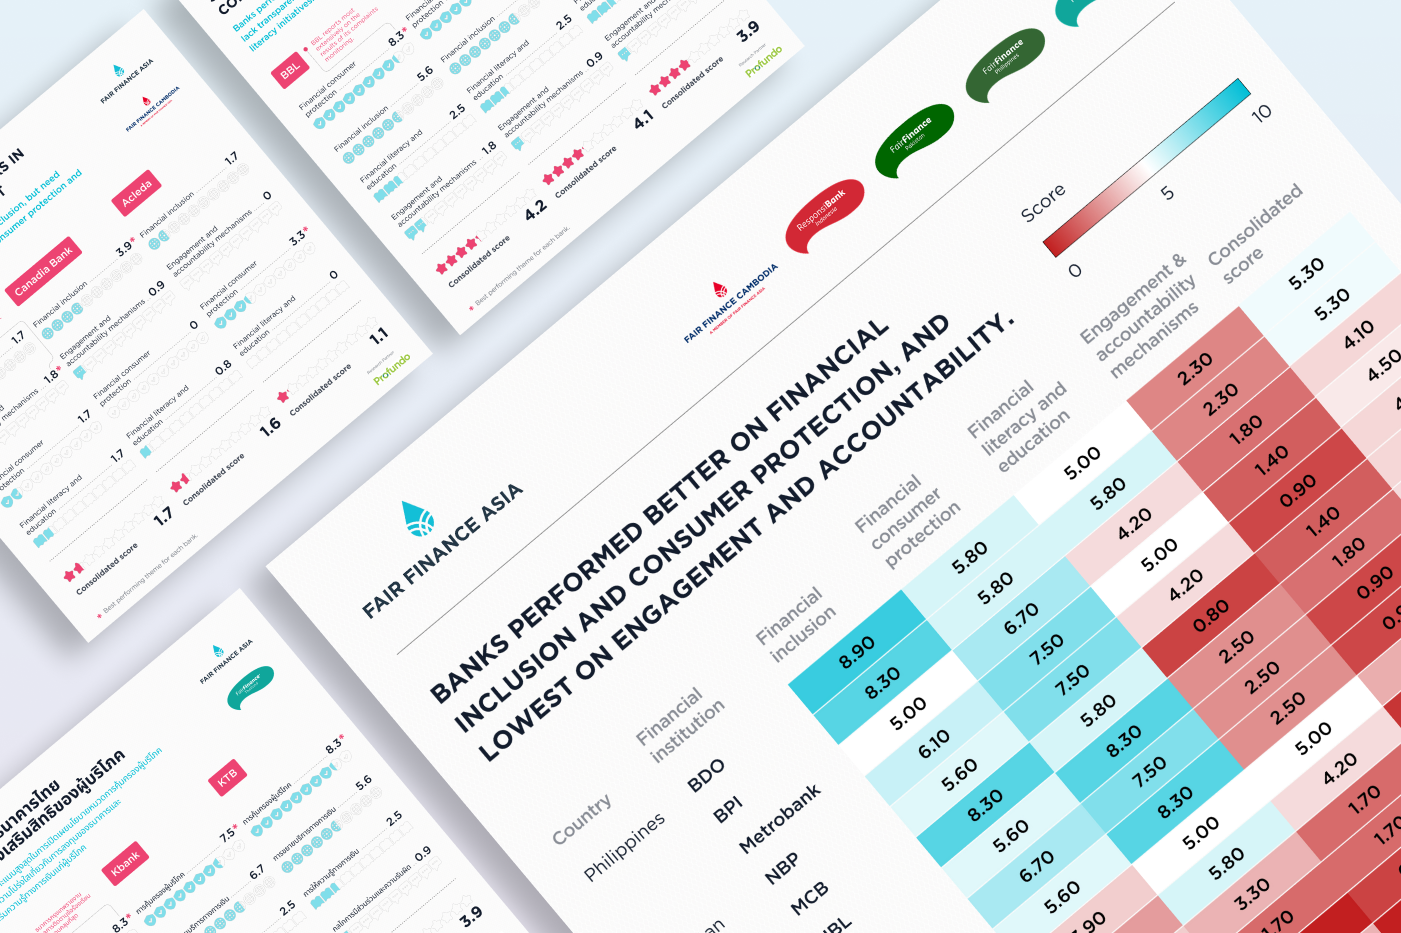
Partner:
Fair Finance AsiaProject type:
Data visualisation
Scope:
Editorial writingData visualisation
Design
About the project
The challenge
Translating a layered report for a wider audience
Showing variation without a clear winner or loser
Our creative solution
|
We resolved both challenges by leaning into restraint. To make the layered data accessible, we chose chart types that readers could parse at a glance. Clarity came before complexity, so the scorecard's structure revealed itself without demanding prior context. Clean, uncluttered design kept the focus on the data itself. It reduced cognitive load for audiences encountering the findings for the first time on social feeds. To communicate regional variation, we designed the country-level visuals as a consistent, repeatable template. Readers could scan across Cambodia, Indonesia, Pakistan, the Philippines, and Thailand and see differences emerge side by side, rather than as rankings. A separate regional visual anchored the set with the four-category averages. It framed the findings as a shared picture of room for improvement. We also provided editorial support on the subtitles accompanying each visualisation. Fine tuning the language helped draw attention to the data points that mattered most. Each infographic carries a clear takeaway for readers scrolling past. |
Our partners
You’ve done the work. Now let us make it exceptional.